What are the major contributing factors of unemployment rate spikes?
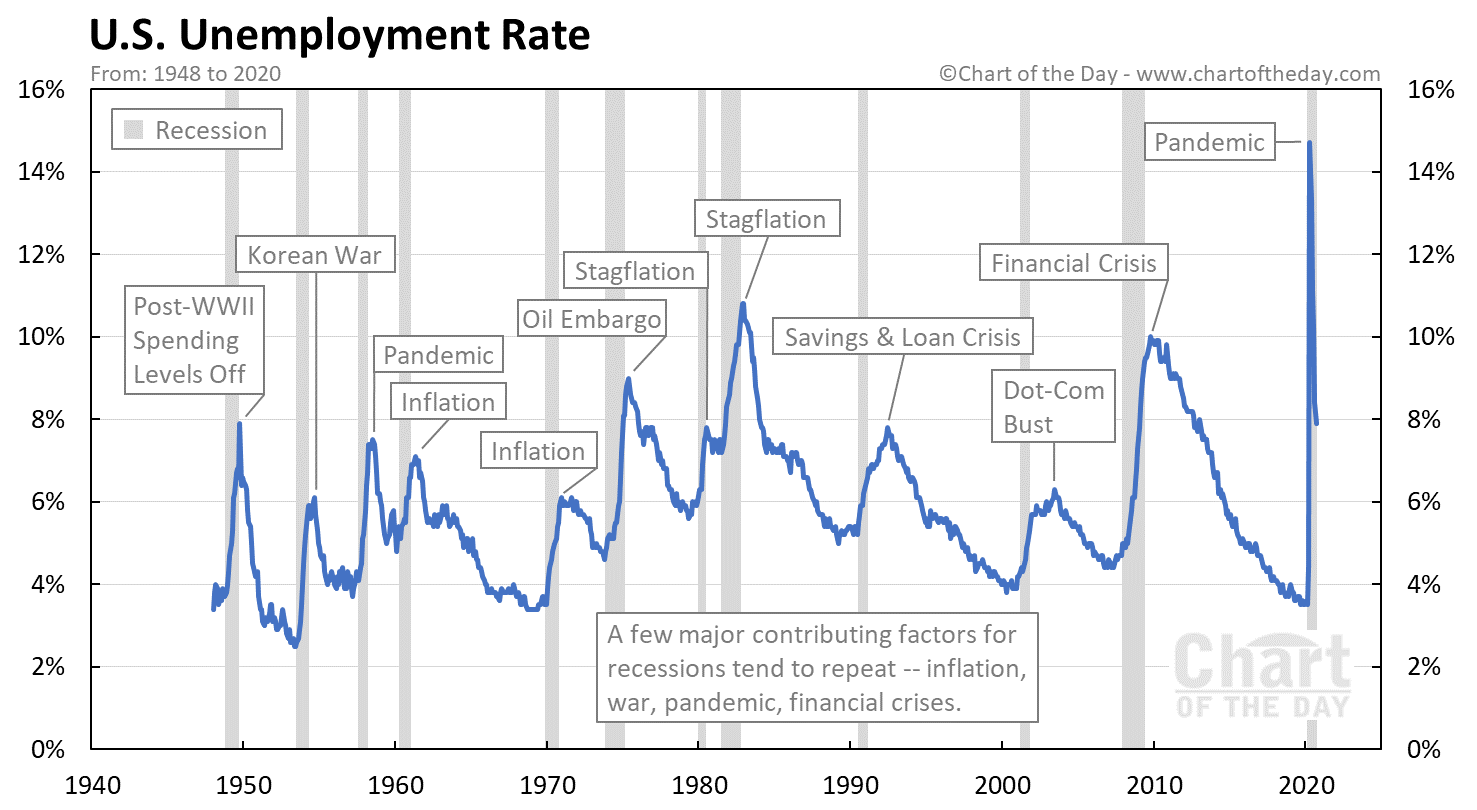
Today’s chart helps answer that question by illustrating the U.S. unemployment rate since 1948.
Notice how the major contributing factor for a spike in unemployment over the past seven decades falls into only a few categories — inflation, war, pandemic and financial crisis.
Of particular interest today is the fact the current pandemic is not the only one that occurred since 1948.
In April 1957, U.S. scientists determined that a pandemic was underway in Asia and predicted that it would arrive in the U.S. in five months (which turned out to be correct).
The U.S. quickly went to work on a vaccine and had one ready to begin vaccinations in July (though it took several months to ramp up production).
In the end, the vaccine likely saved countless lives and helped keep the peak unemployment rate below 8%.
Even with this quick response, the 1957 pandemic still impacted the U.S. economy as it resulted in lower exports to nations which were hardest hit.

What was the lowest U.S. unemployment rate in history?
The lowest U.S. unemployment rate on record occurred in May 1953 and June 1953 and clocked in at a rate of 2.5%.
What was the highest U.S. unemployment rate in history?
Researchers at the National Bureau of Economic Research estimate that the peak unemployment rate reached 25.6% in May 1933 at the height of the Great Depression. The highest U.S. unemployment rate on record (since 1948) occurred in April 2020 as the result of an economic shutdown in response to the COVID-19 pandemic.
What is the U3 unemployment rate?
The U3 unemployment rate is the headline number often reported by the popular press for US unemployment. It attempts to quantify the percentage of people actively looking for a job.
How is the U.S. unemployment rate determined?
To determine the U.S. unemployment rate, the Bureau of Labor Statistics conducts a monthly Current Population Survey.
