Are large-cap or small-cap stocks a better investment?
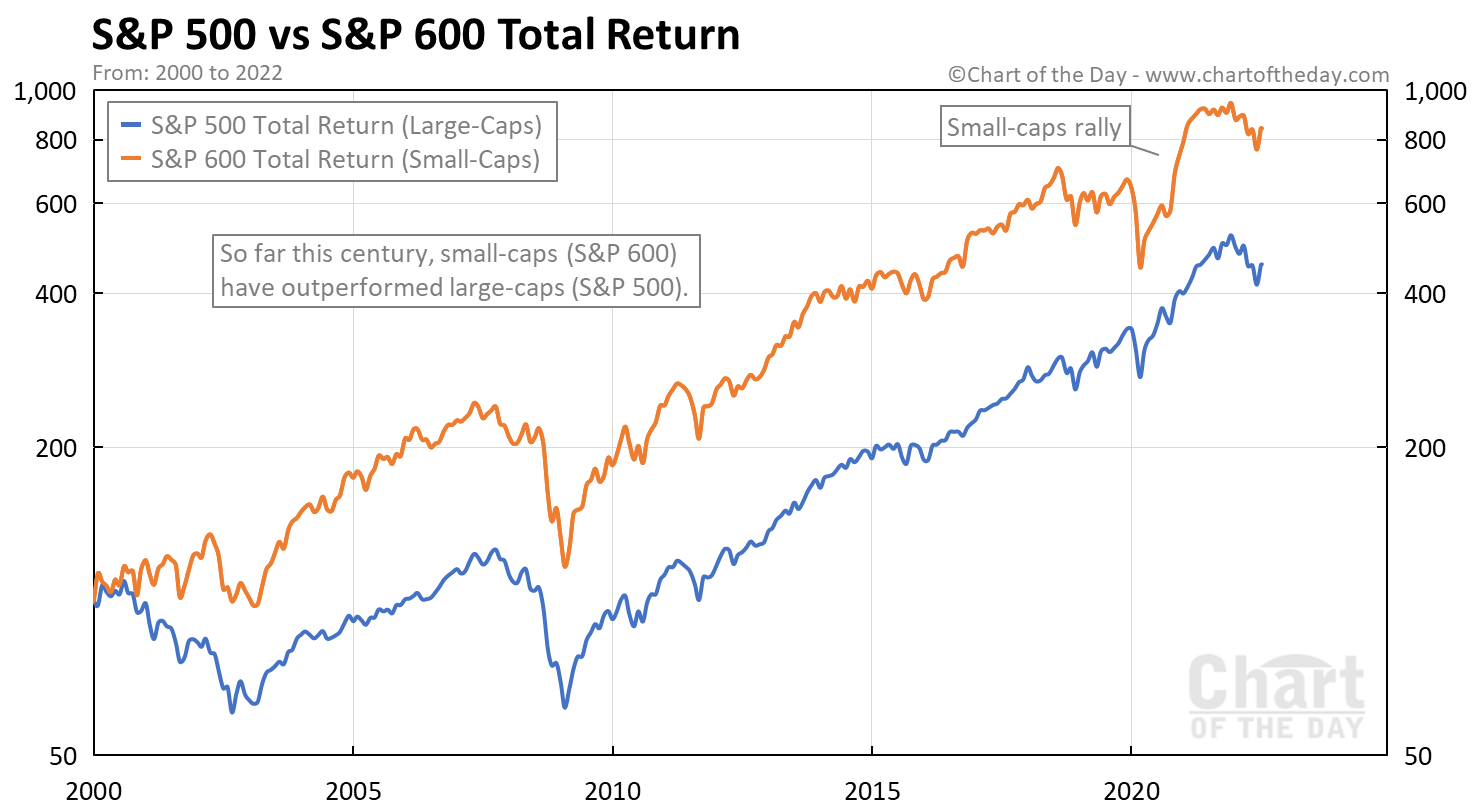
Today’s chart answers that question by presenting the total return trend for both the S&P 500 and S&P 600 Index.
Today’s chart illustrates that, so far this century, small-caps (orange line) have outperformed large-caps (blue line).
It is worth noting, that small-caps did underperform leading into and during the pandemic induced bear market.
Although, small-caps did bounce back as vaccines came on the scene and the economy began to reopen.
In 2022, however, small-caps and large-caps have put in a similar performance.

What is the S&P 600?
The S&P 600 is a capitalization-weighted U.S. stock market index that is comprised of 600 small-cap companies.
How are the stocks of the S&P 600 selected?
The 600 stocks that make up the S&P 600 are selected by Standard & Poor’s and must have a market capitalization of $700 million to $3.2 billion in addition to meeting certain liquidity and stability requirements.
When was the S&P 600 created?
The S&P 600 was created in October 1994 by Standard & Poor’s.
Is there a S&P 600 ETF?
Yes. In fact, there are several S&P 600 index funds. The largest is the iShares Core S&P Small-Cap ETF (IJR).
