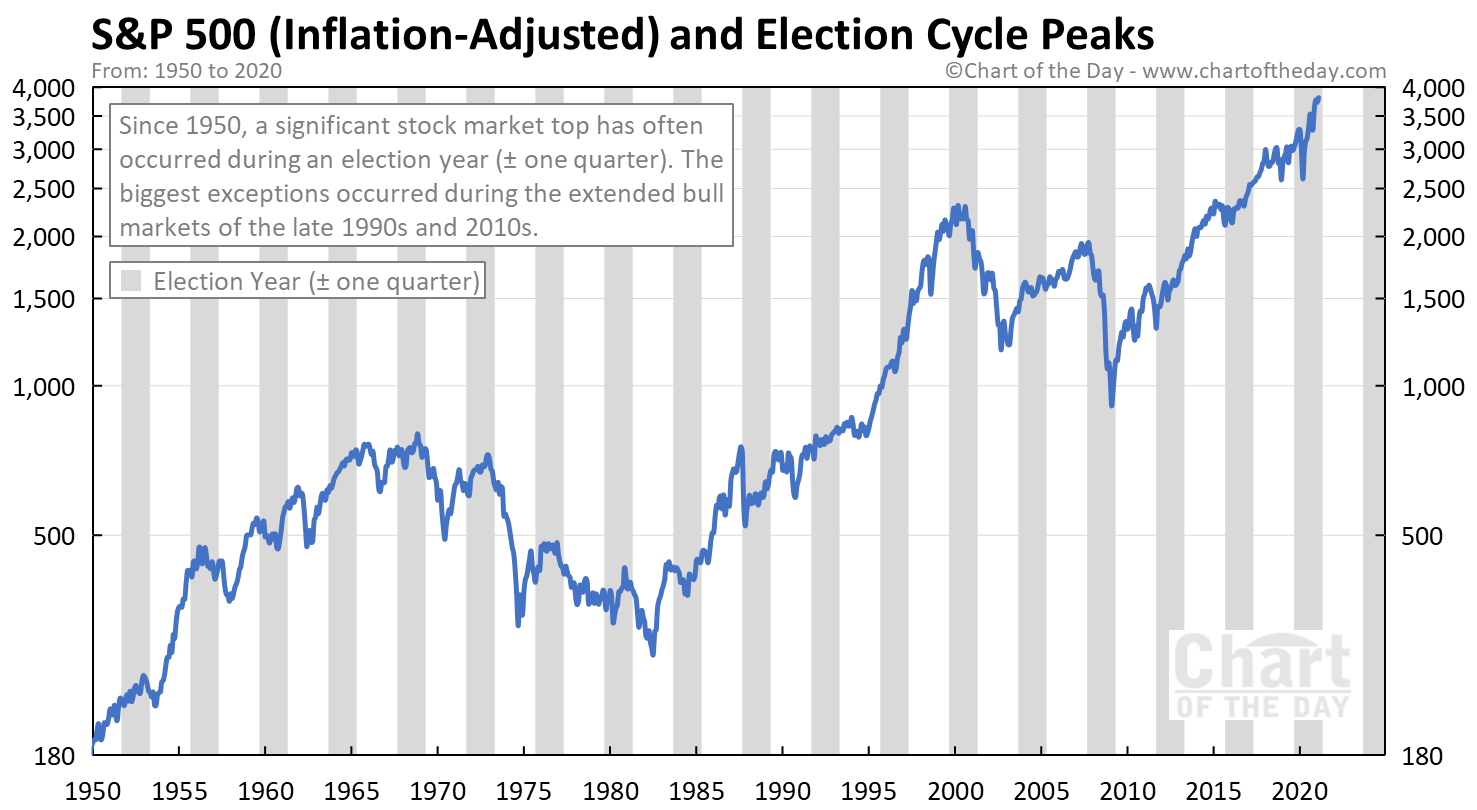
With the 2020 U.S. election behind us, today’s chart takes a unique look at the presidential cycle.
Today’s chart illustrates how the majority of major stock market tops have occurred during a presidential election year (plus or minus one quarter).
One theory for this phenomenon is that the party in power will typically make difficult economic decisions in the early years of a presidential election cycle.
Then, as a new election approaches, the acting administration will do everything within its power to stimulate the economy to increase the odds of re-election.
With this in mind, forward-looking investors adjust their holdings well in advance of these policy shifts.

How often has the Dow gained during a presidential election year?
Since 1900, the Dow has ended an election year on the positive side 22 out of 31 times for an average win rate of 71%.
What was the biggest gain by the Dow during a presidential election year?
The biggest election year gain since 1900 occurred in 1928 when the Dow gained 48.2%.
What was the Dow's biggest loss during a presidential election year?
The Dow’s biggest loss during a presidential election year since 1900 was 33.8% in 2008.
How did the Dow perform during the most recent presidential election year?
For the calendar year of 2020, the Dow was up 12.2%.
