Dow investors enjoyed a nice rally over the past week.
In fact, the Dow is up 17% and change since its September 2022 lows.
So, how is the Dow performing relative to that other global currency — gold?
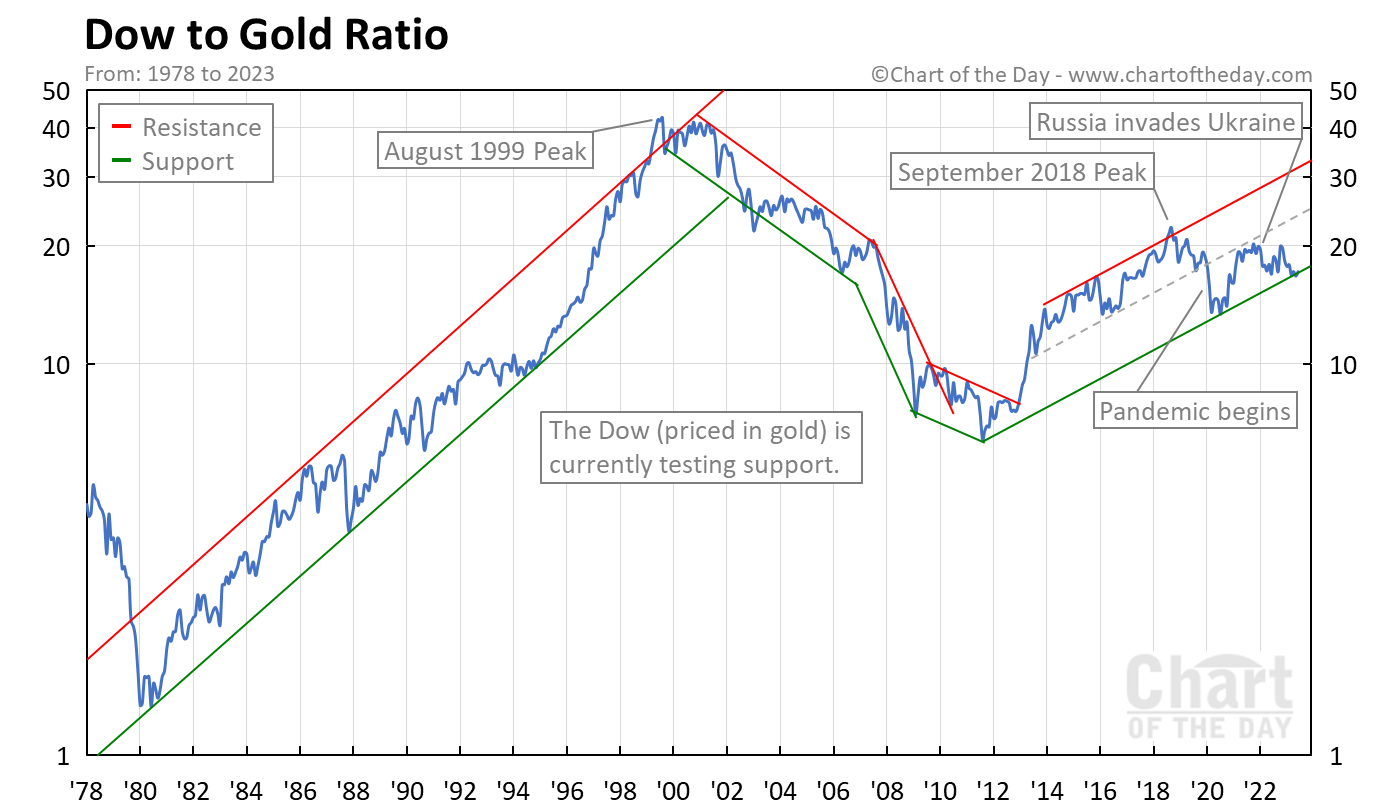
To answer that question, today’s chart illustrates the Dow to Gold Ratio.
As today’s chart illustrates, the Dow priced in gold has been trading flat / choppy since its September 2018 peak.
Longer-term, the Dow to Gold Ratio is currently testing support (green line) of its upward sloping trend channel.

What is the Dow to Gold Ratio?
The Dow to Gold Ratio simply indicates the number of ounces of gold it would take to “buy the Dow.”
How do you calculate the Dow to Gold Ratio?
To calculate the Dow to Gold Ratio, simply take the price of the Dow and divided it by the price of one ounce of gold.
What was the highest Dow to Gold Ratio?
Since 1978, the highest Dow to Gold Ratio was 42.5 in August 1999.
What was the lowest Dow to Gold Ratio?
Since 1978, the lowest Dow to Gold Ratio was 1.3 in January 1980.
