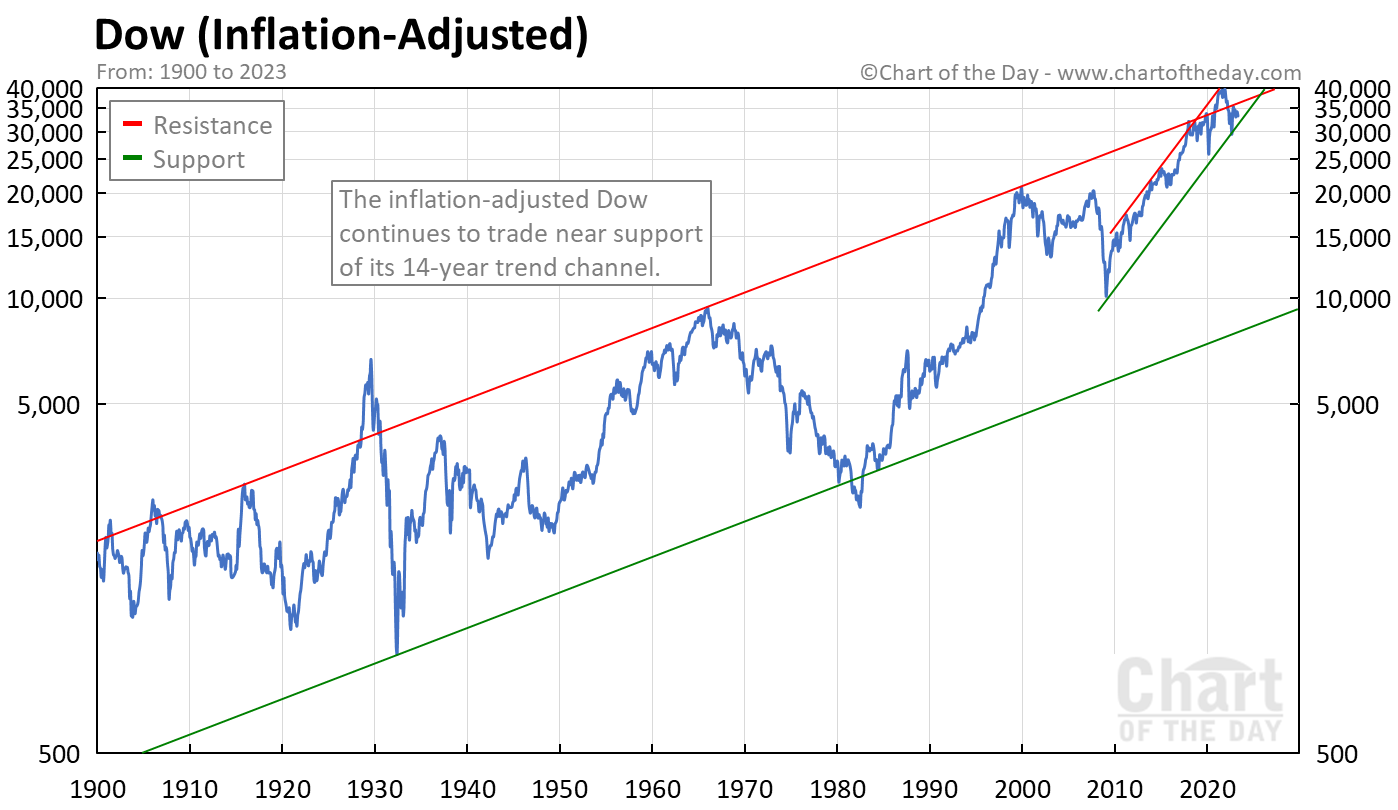
Since 1900, the Dow (adjusted for inflation) has mostly traded within the confines of a long-term trend channel.
Currently, the Dow is trading slightly below resistance of its 123-year trend channel (long red line).
The Dow has traded at or above long-term resistance several times in the past — 1901, 1906, 1915, 1929, 1966, 1999, and 2021.
It is worth noting that soon after each resistance test, the market struggled.

When did the Dow start?
Charles Dow first published the Dow Jones Industrial Average on May 26, 1896. On this day, the Dow consisted of only 12 companies.
Who maintains the Dow Jones Industrial Average?
The Dow is maintained by S&P Dow Jones Indices.
What are the Dow components?
The 30 stocks which make up the Dow Jones Industrial Average are: 3M, American Express, Amgen, Apple, Boeing, Caterpillar, Chevron, Cisco, Coca-Cola, Disney, Dow, Goldman Sachs, Home Depot, Honeywell, IBM, Intel, Johnson & Johnson, JP Morgan Chase, McDonald’s, Merck, Microsoft, Nike, Procter & Gamble, Salesforce, Travelers, Unitedhealth, Verizon, Visa, Walgreens, and Walmart.
How can you invest in the Dow?
You can invest in the Dow with the SPDR Dow Jones Industrial Average ETF. This ETF tracks the Dow and has a relatively low expense ratio.
